Explore VetCompass findings on UK cats!
 We have just released new additions to the growing collection of interactive data displays (‘infographics’) available on the VetCompass website! These visual tools provide handy summaries of demographic information & disease prevalence estimates for UK pets, generated using the huge volumes of data collected through the VetCompass programme. Our new displays are feline-focused, complementing the original canine versions developed using an RCVS Knowledge Trust award in 2014.
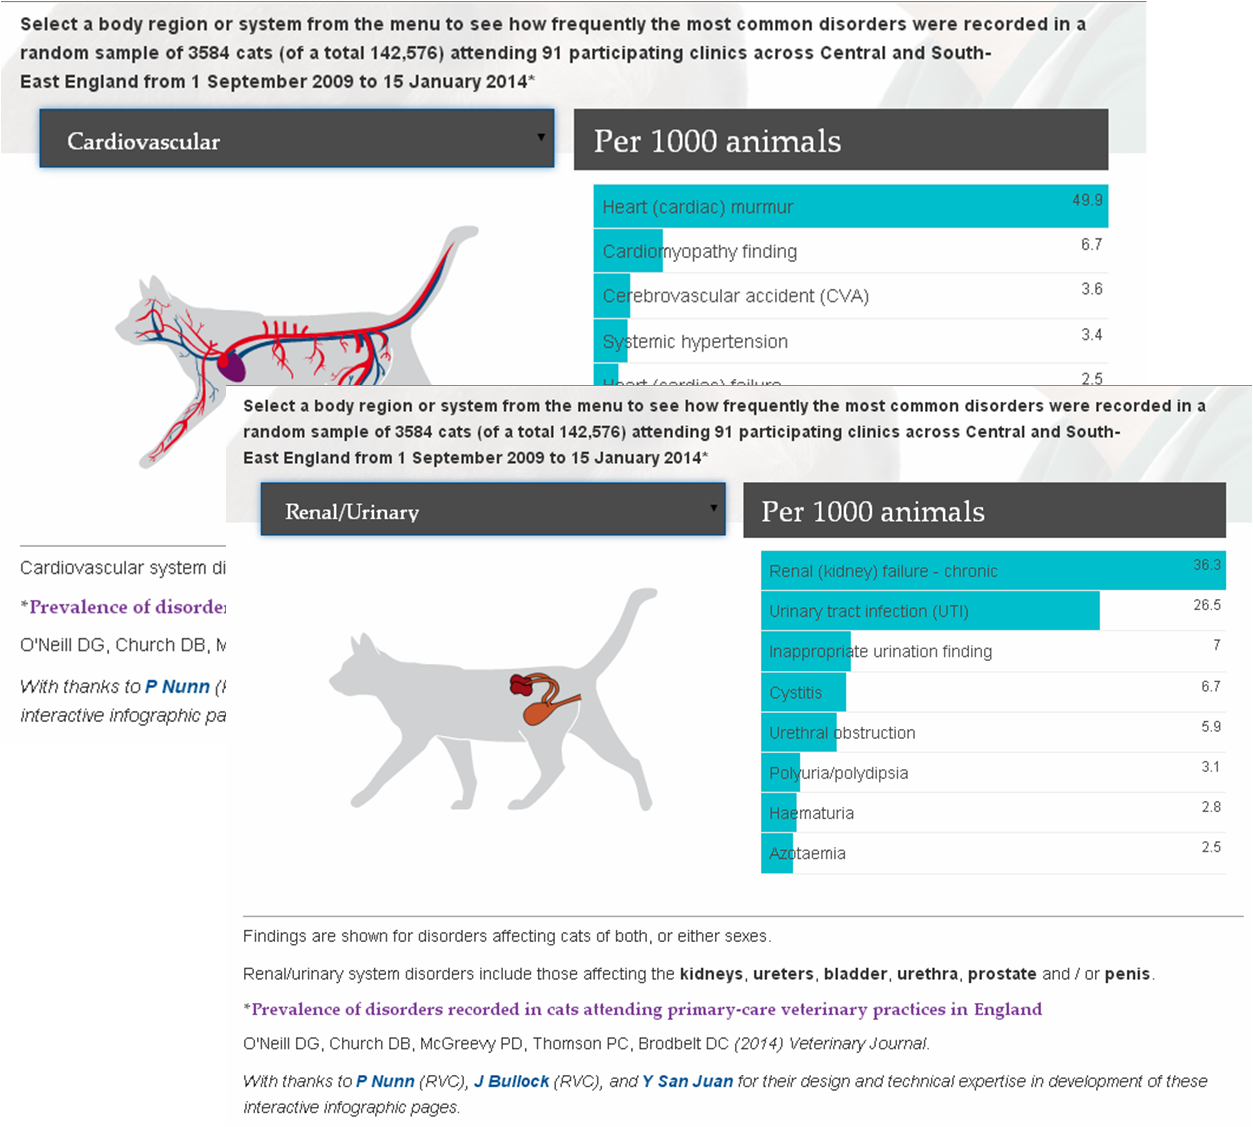
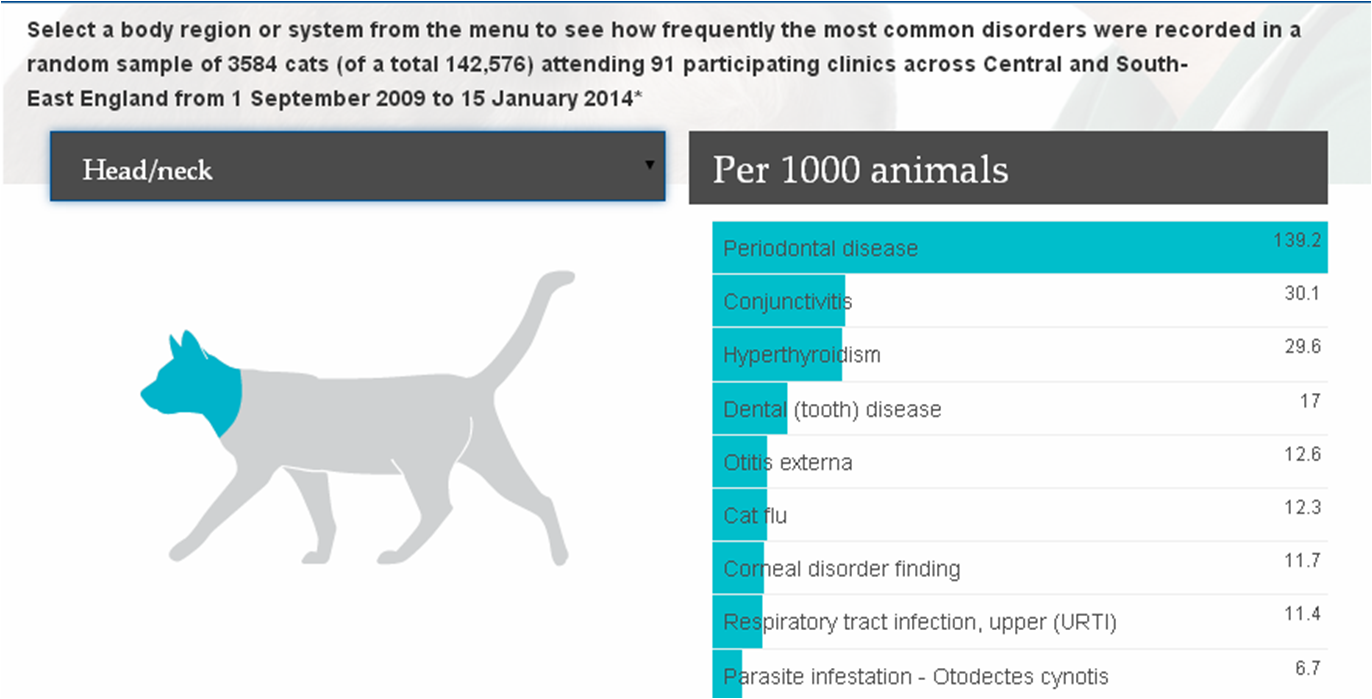
Interactive Feline Disorder Prevalence pages have been created, allowing users to explore the most common disorders affecting UK pet cats overall and by individual anatomical area or functional body system. These estimates are based on a random sample of 3584 cats (from a total of 142,576) attending 91 participating clinics between 1 September 2009 to 15 January 2014*.
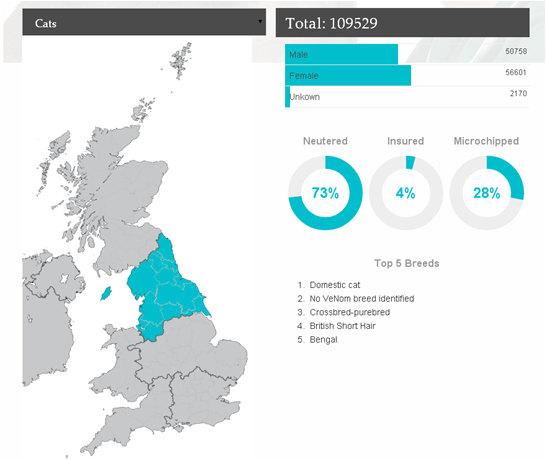
The existing Canine Demography infographic page has also been expanded to include useful statistics on the UK pet cat population. Visitors to this page can now filter pet demographic data summaries by species and by broad geographical region to explore variation within canine and feline populations across the UK. Our feline demographic data summaries are derived from information on 588,186 individual cats which attended 299 VetCompass-participating, primary-care veterinary clinics.
All our interactive displays are designed to provide a clear, accessible platform from which to share key VetCompass findings with those interested in pet health and welfare. We are always keen to make improvements, so feel free to contact us with comments/suggestions for any of these pages!
*Prevalence of disorders recorded in cats attending primary-care veterinary practices in England.
O'Neill DG, Church DB, McGreevy PD, Thomson PC, Brodbelt DC (2014) Veterinary Journal
